
If "Lighting the Way Forward: Tripura’s Journey to a Sustainable Energy Future " was the “what and why,” this post is the how the concrete steps Tripura will take across generation, transmission, distribution, and trading to reach 500 MW of renewables, ≤ 12% AT&C losses, and zero outages by 2030.
The destination-and what it takes to get there
A whole‑of‑system plan to add 500 MW of renewable capacity, cut AT&C losses to ≤ 12%, and take outages to zero by 2030—with coordinated investments in generation, transmission, distribution, and power trading. Demand is rising fast while today’s supply leans on gas and purchased power. Clean, state‑owned generation and a smarter grid keep bills stable and lights on.
Targets:
- RE capacity: Rises from 0 → 185 MW → 500 MW (short → medium → long term).
- AT&C losses: Fall from 23% → 16% → 12%.
- Outages: Drop to zero statewide by 2030.
- Investment: About ₹6,800 crore through 2030—₹1,800 crore (generation), ₹1,700 crore (transmission), ₹3,300 crore (distribution).
Why this mix: State‑owned, low‑cost solar (including floating solar) plus smarter conductors keeps tariffs in check while reliability improves.
1) Distribution Efficiency and Infrastructure upgradation
A. Network upgrades
- Reconductoring HT/LT lines and replacing weak joints/earthing where demand has outgrown conductor capacity.
- Underground cabling on vulnerable urban/mixed feeders to cut storm‑related faults and speed restoration.
- Sub‑station augmentation + new 11 kV feeders to distribute load more evenly.
- Protection & automation: FPIs, RMUs, auto‑reclosers, and fault locators across priority areas to shorten outages.
- HT:LT ratio improvement—first in cities, then rurally—to reduce technical losses.
Targets:
- Short term: reconductor high‑load spans; underground select urban feeders; add feeders/sub‑station MVA; install FPIs/RMUs/reclosers on priority circuits.
- Mid term: extend undergrounding and automation beyond core cities; HT:LT ratio improves in urban areas.
- Long term: HT:LT improvements reach rural; hotline maintenance (live‑line) methods in cities; a network model up to DT level is regularly updated to plan upgrades.
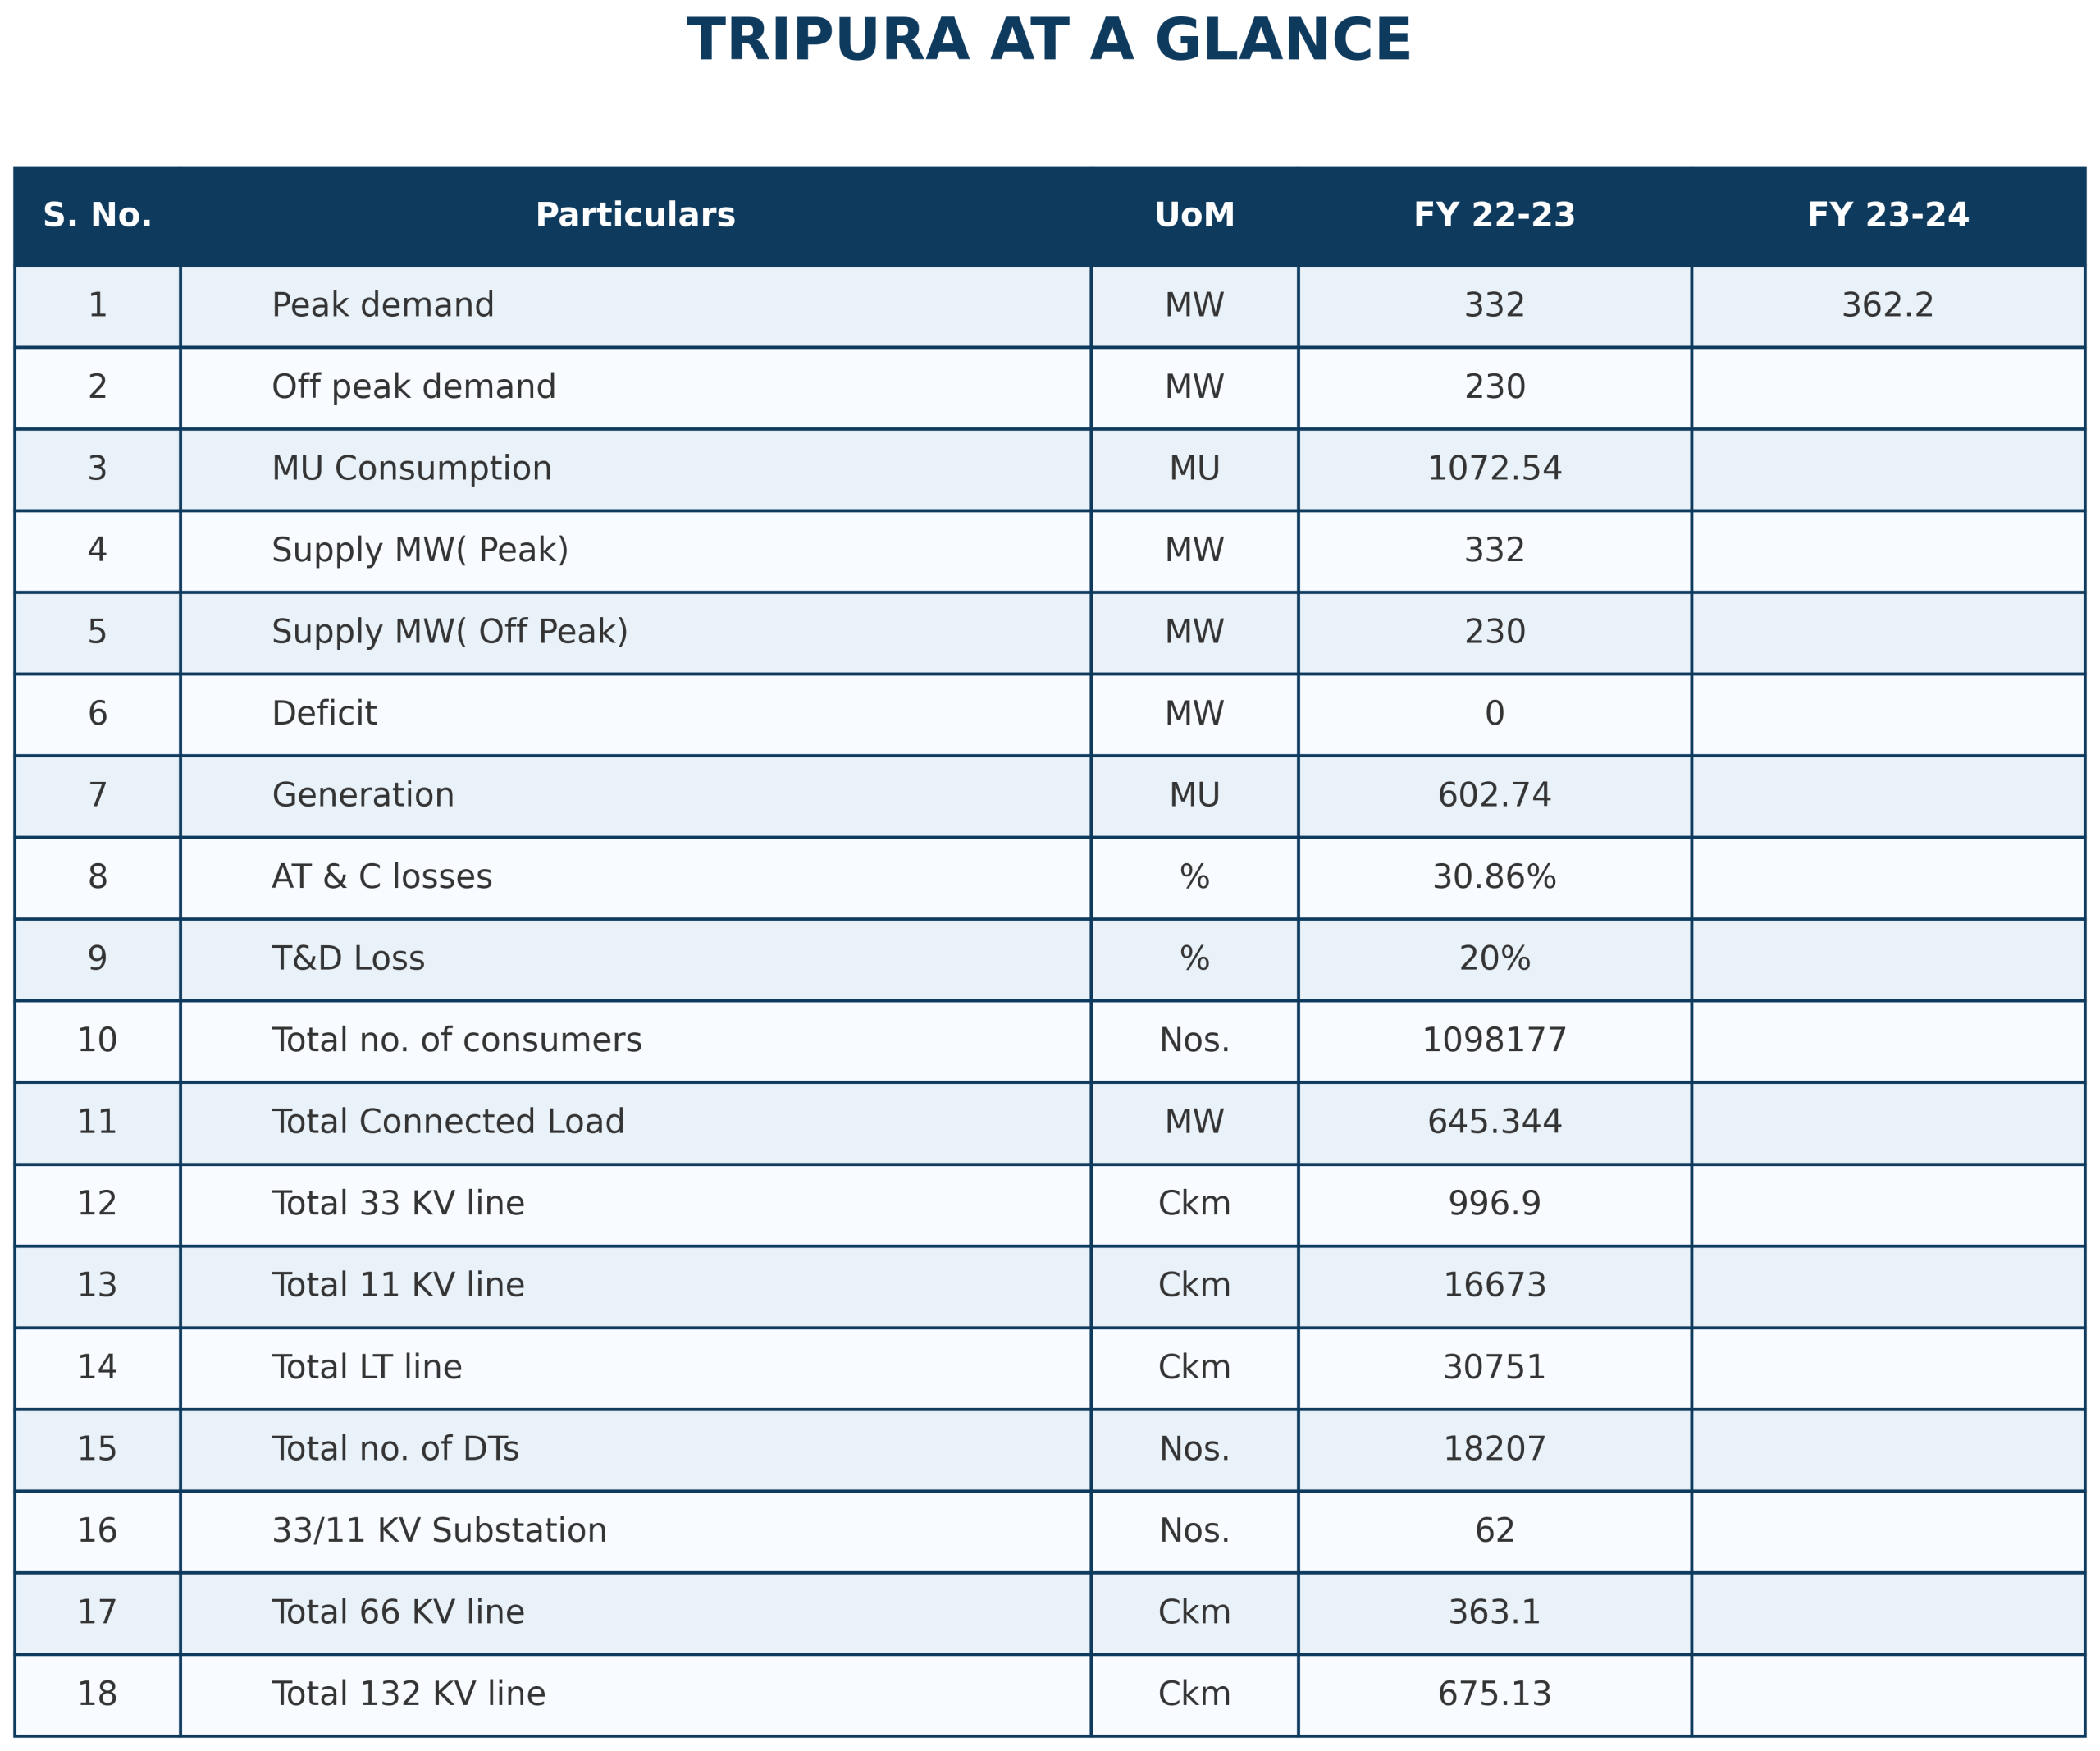
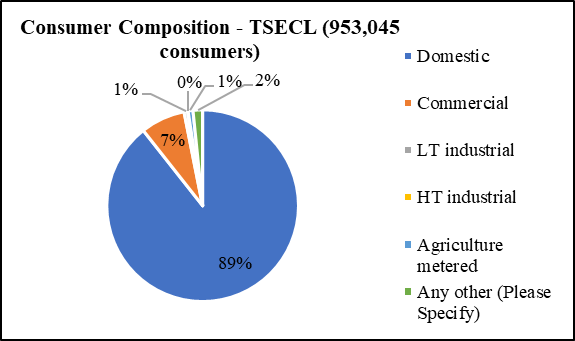
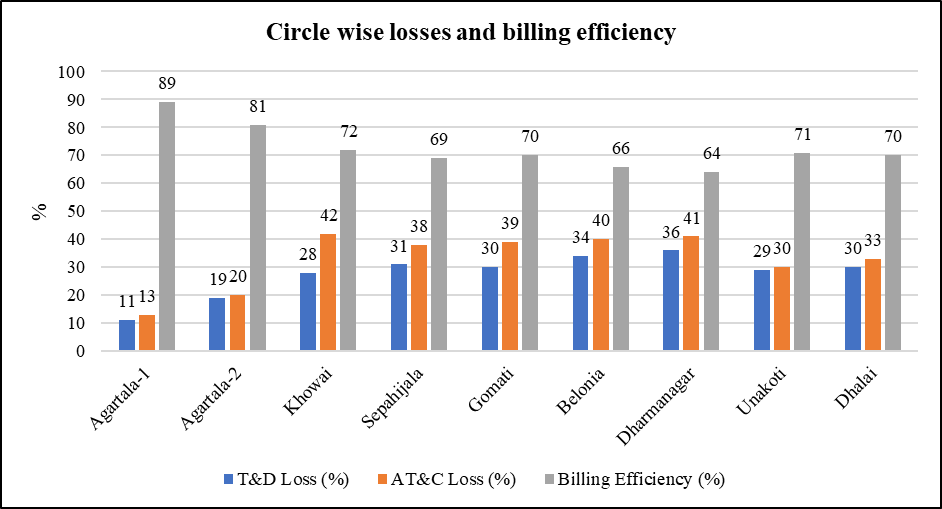
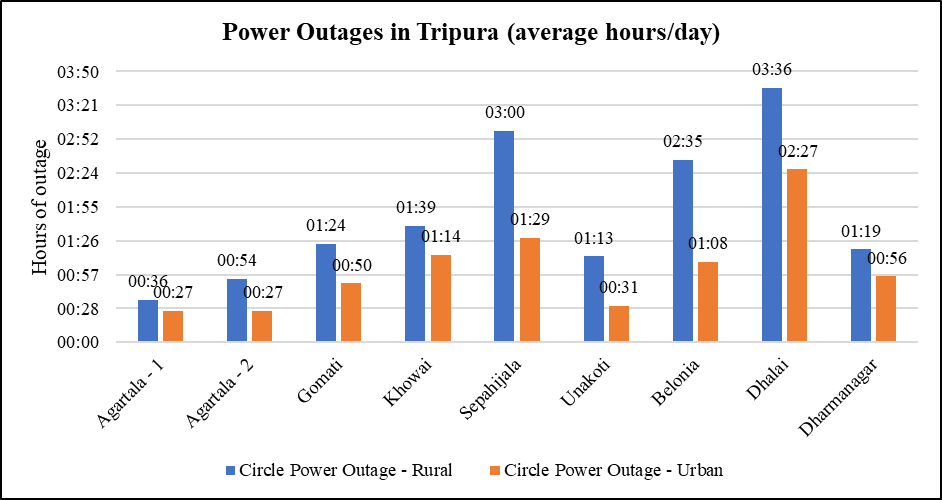
Why this matters: Consumers are mostly domestic (≈ 89%) on a wide network (~18,886 km at 11 kV; ~32,900 km at LT). Many divisions face ~30% AT&C losses, and rural outages last longer than urban. Upgrading the physical network directly reduces both losses and downtime.
Several activities, including AB cable reconductoring, distribution transformer augmentation, construction of new feeders, and substation upgrades are currently underway under the RDSS and ADB schemes.
B. Process and operations: the “invisible” fixes
- 100% GIS asset & consumer indexing and 100% smart metering, so every pole, transformer, feeder, and service is on the map and measurable.
- ERP + GIS + AMI integration to track inventory, work orders, billing, and outages in one data spine.
- Demand response pilots (initially > 20 kW customers) to shave peaks.
- Volt‑VAR Optimization where rooftop PV grows—to keep voltage inside limits and protect equipment.
- Reliability targets: Urban zero outages by the mid‑term.
Why it matters: Low billing efficiency is a big reason AT&C stays high. When meters, maps, and billing share the same truth, units billed match units sold and faults are handled faster. Proof: the Agartala smart‑grid pilot delivered ₹50 million (loss reduction) + ₹82 million (better billing) in four years.
A pilot project for GIS mapping and consumer indexing is currently underway in the Khowai and Teliamura divisions.
C. Advanced tech—find the fault before it finds you
- Drones/IR cameras to spot hotspots and weak joints (short term → scale to all districts by 2030).
- AMI rollout: city first, five major districts next, statewide by the long term.
Why it matters: As rooftop and utility solar rise, the grid must react in real time. These tools cut outage minutes, stabilize voltage, and make field work safer and faster.
Targets:
- ’23–’24: IR/drone preventive maintenance pilots; smart meters in Agartala.
- ’25–’27: smart meters in 5+ major districts; OMS/ADMS/DERMS; VVO in key areas.
- ’28–’30: state‑wide AMI; ADMS in Agartala & major districts; OMS/VVO extended across service area.
2) Generation strategy: efficient gas + rapid renewables
A. Get more from the gas fleet
- Convert open‑cycle to combined‑cycle: one ongoing conversion takes 63 MW OCGT → ~120 MW CCGT, lifting efficiency and cutting fuel per unit.
- Ease fuel constraints via new gas field at Khubal (~0.44 MMSCMD) and the North‑East gas pipeline build‑out—so existing and new plants can run as planned.
Why it matters: Same gas, more electricity and lower emissions per unit—and less reliance on expensive purchases. Gas availability is improving.
OCGT vs CCGT — what changes when Tripura converts its gas plants
At a glance
| Attribute | Open‑Cycle Gas Turbine (OCGT) | Combined‑Cycle Gas Turbine (CCGT) |
|---|---|---|
| Thermal efficiency | ~25–40% (Tripura’s OCGT fleet is cited around the mid‑30s) | >50%, typically around ~60% with modern configurations |
| CAPEX | Lower (simpler plant) | Higher (adds a steam cycle and auxiliaries) |
| OPEX | Higher per kWh (more fuel burned for the same output) | Lower per kWh (better heat rate/fuel economy) |
| Exhaust heat | Hot gases dumped to atmosphere after the gas turbine | Hot gases are reused in a second cycle (fed back into the process) to make extra power |
B. Build where power is cheapest
What to build: Utility‑scale solar including floating solar on Tripura’s lakes/reservoirs; storage where feeders serve hospitals, water works, or dense urban pockets; and a single‑window push for rooftop PV.
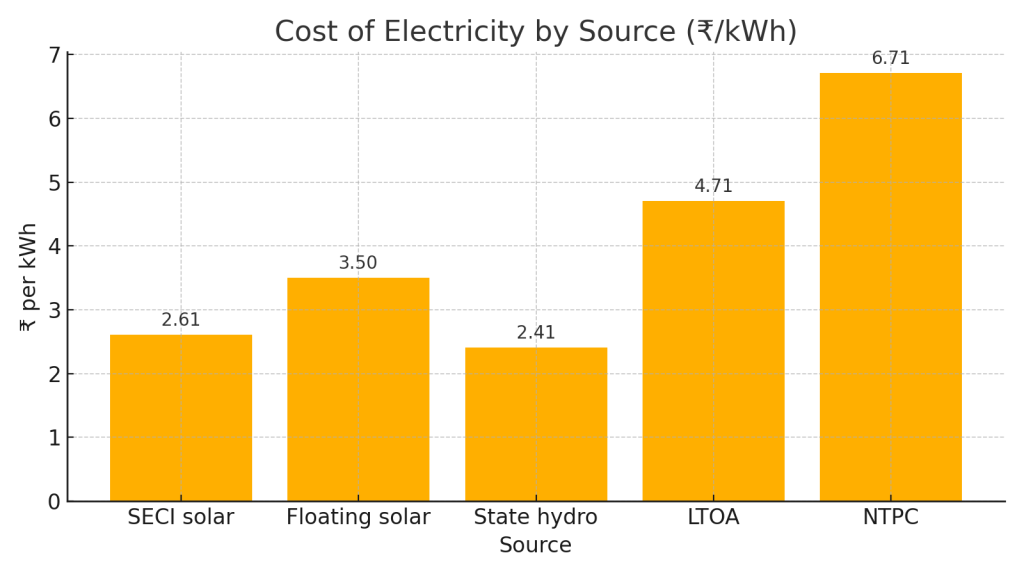
- Cost stack today: : Local clean power is cheaper than much of what we buy.SECI solar ~₹2.61/kWh; floating solar ~₹3.50; state hydro ~₹2.41—all cheaper than average LTOA (~₹4.71), with some central allocations even higher (e.g., NTPC ~₹6.71). That’s why the plan centers 500 MW of state‑owned RE by 2030.
Targets:
- Capacity: 500 MW state‑owned RE by 2030 (~185 MW by 2027).
- Projects: 130 MW floating solar at Dumbur (planning) plus additional lakes; rooftop single‑window; ESS for PV‑heavy urban feeders; DG‑to‑Battery programs at consumer premises.
- Innovation: Peer‑to‑peer rooftop trading pilots using blockchain (mid‑term).
- Floating‑Solar Hero (anchoring, evacuation path, O&M callouts). Caption: “Tripura’s water bodies as power plants.” Tripura Energy vision 2030 Repo…
C. Rural & frontier options
Microgrids for remote hamlets, biomass where feedstock exists, mini/micro hydro where terrain allows, and solarized agri‑pumps to cut diesel use. Street‑lighting and community RO plants go solar.
- Off‑grid/Rural: Solar microgrids for 500 remote hamlets; biomass and mini/micro‑hydro where viable; solarized agri‑pumps at scale.
- Next waves: Green hydrogen (80–100 kg/day pilot), geothermal pre‑feasibility near gas fields, and carbon capture pilots—phased after DPRs.
Why it matters: Many hamlets are hard and costly to serve with long LT lines. Local generation gives reliable power and water without waiting for a far‑away feeder upgrade
Targets:
- Status & potential: 2 kW microgrids already demonstrated in twelve hamlets; ~7.8 MW of off‑grid systems installed; 500 remote localities identified for microgrids.
- Scale targets: phased roll‑out of solar microgrids (towards all 500 hamlets), thousands of 2 kW solar pumps (PM‑KUSUM), and large‑scale solar street‑lighting as part of a 500 MW DER push by 2030.
3) Transmission & trading: reliability that pays for itself
A. The backbone upgrade
Build new 132 kV lines and substations, reconductor older corridors, and add OPGW for reliable protection/communication—plus a ring‑main for Agartala so the city can be fed from multiple directions.
Targets:
- Today: 86 substations (~1,246 MVA).
- Build‑out: 9 new lines (~453 ckm), 9 new substations (~752 MVA), ~475 ckm reconductoring, and OPGW on new 132 kV lines.
- Design choices: a 132 kV ring‑main for Agartala; stronger corridors to remote areas; capacity for industrial towns; and headroom for cross‑border/domestic trade.
Why it matters: A stronger backbone absorbs new RE, supports industrial towns, offers redundancy to remote areas, and enables lucrative trading.
B. Trade smart—domestic and cross‑border
Keep and expand the cross border expand
Targets:
- Bangladesh: ~192 MW RTC export on a tariff with 2% annual escalation—already moving real revenue.
- Bank the seasons: Summer deficits here meet hydropower surpluses in Bhutan/Nepal; in winter, Tripura can export.
- Bottom line: When interstate + cross‑border trade are factored, the ACS–ARR gap shrank from ₹1.62/kWh to ₹0.33/kWh in one recent analysis—meaning materially lower annual losses for the utility.
- Next: Optimize IEX/market sales, renew Bangladesh arrangements, and keep a watching brief on the Sri Lanka interconnection opportunity.
Why it matters: When trading is counted, the ACS–ARR gap shrinks dramatically—from ₹1.62/kWh to ₹0.33/kWh in one assessment—reducing annual losses and the need for heavy subsidies. Today, Bangladesh takes ~192 MW RTC on a tariff with 2% annual escalation—already real revenue.
4) Timelines that stack, not sprawl
- Short term (’23–’24): Reconductor and underground the most fragile spans, add feeders/sub‑stations, start AMI in Agartala, launch drones/IR patrols, and lock the ERP–GIS–metering integration plan. Targets: AT&C ≤ 23%; urban outages ≈ 30 min/day, rural ≈ 1.5 hr/day.
- Mid term (’25–’27): Take AMI to five+ districts; deploy OMS/ADMS/DERMS; commission ≈ 185 MW of RE; expand undergrounding; urban zero‑outage; AT&C ≤ 16%.
- Long term (’28–’30): Hit 500 MW RE; zero outages statewide; AT&C ≤ 12%; storage along critical feeders; transmission ring/main corridors complete; robust domestic and cross‑border trading strategy in place.
5) Who gains—households, farms, and factories
- Fewer blackouts, steadier voltage: Undergrounding + automation shrink fault time; VVO protects appliances and industrial motors.
- Tariff stability: More low‑cost, state‑owned RE + smarter trading narrows the ACS–ARR gap and limits dependence on heavy subsidies.
- Growth‑ready power: Industrial parks, traction loads, and bulk consumers get a grid designed for uptime. Rural hamlets get dependable power and water via microgrids and solar pumps.
Suggested visual: Customer Outcomes Snapshot (SAIDI/SAIFI trend, ACS–ARR narrowing, RE share rising). Caption: “Reliability up, cost pressures down.” Tripura Energy vision 2030 Repo…
6) What to track- so plans don’t drift
- AT&C loss (circle → division → feeder) against the 23% → 16% → 12% glidepath.
- Reliability from OMS (SAIDI/SAIFI) with separate urban/rural targets.
- RE build (grid + floating + rooftop) and storage commissioned on critical feeders.
- Transmission milestones (ckm energized, MVA added, OPGW installed).
- Trade outcomes (market revenues, net impact on ACS–ARR). Tripura Energy vision 2030 Repo…
Bottom line
Tripura’s pathway is practical: fix the wires and processes first, build low‑cost power at home, run gas plants efficiently, and trade smart to hold tariffs steady. Hit the near‑term sprints—reconductoring, targeted undergrounding, AMI/OMS rollout, and the first ~185 MW of RE—and the longer‑term goals (500 MW RE, ≤ 12% AT&C, zero outages) become achievable, not aspirational.
Thanks for the detailed climate metrics
Really appreciate this emission data
Really enjoyed! Really means a lot
Excellent information on emission factors Neeraj
Extremely insightful Neha!
This is a game-changer for emission tracking! 🎯
Thanks for the clear explanation of carbon intensity
Thank you Nikhil!
Really useful for sustainability transformation. ⚡
This helps with our greenhouse gas inventory. 📈
Thanks for your engagement! Glad you liked it
Thanks Neeraj for highlighting carbon reduction opportunities
Excellent resource for climate compliance Neeraj!
Great resource for climate leadership!
Thank you Namita!
Excellent resource for emission reduction planning
Extremely appreciated Anjali!
This helps us meet our climate goals. 🎯
Thanks Neeraj for the clear decarbonization pathways
Really appreciate that Harsh!